🧠 Intelligent Investments with Nassim Taleb
How to measure risk for a well balanced portfolio?


I started reading The Intelligent Investor by Benjamin Graham right after reading Black Swam, Antifragile and Fooled by Randomness by Nassim Taleb.
Here are some interesting notes so far:
- Differently from Nassim Taleb, I've noticed far greater confidence in "knowing the real value behind stocks" from Benjamin Graham. However, he does mention how "not acting in an immature manner" is better than "giving tips on how to get the most out of your investments". This approach matches a lot of what Nassim wrote in his books.
- Both do tend to value emotional intelligence when picking stocks and knowing what to expect from a reasonable investment (ergo, NOT 4% a day with a secure investment lol).
I started reading more on investments because I want to follow what Nassim Taleb described as a Barbell Strategy.
The Barbell Strategy
90% of one's portfolio on very conservative low-risk investments, 10% of exposure to high-risk, uncertain, assets.
But before we start measuring Risk(You can't, according to Nassim), we need to understand the types of things that are measurable or predictable.
The Turkey's Problem
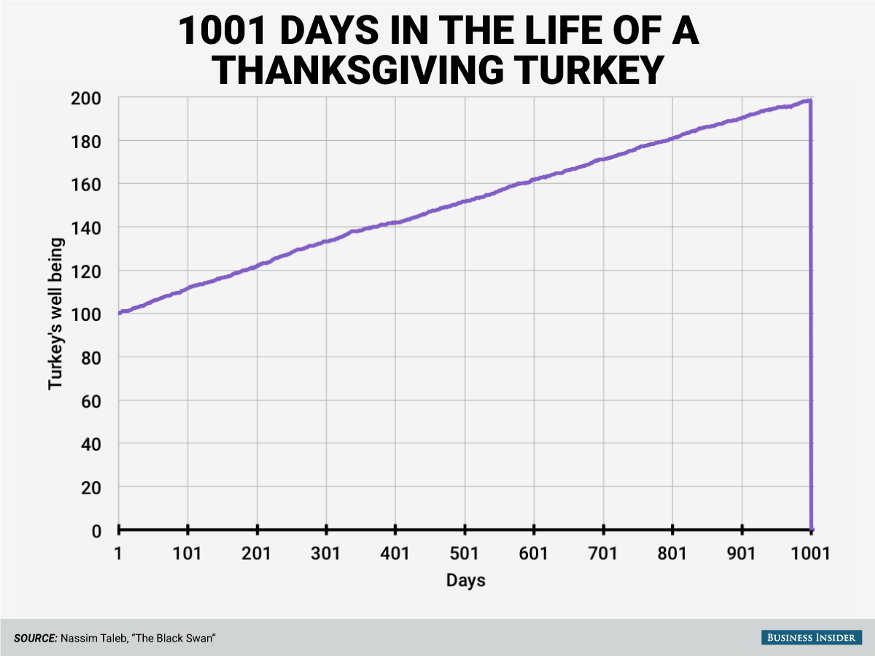
You see as the time approaches thanksgiving, the turkey gets more and more confident that "on the next day a peaceful human will feed and take care of me".
Turkey's induction reasoning is correct, but there are limits to where induction-based reasoning can lead us. There are things that will appear before us that we could never have predicted because they had never happened before.
Nassim called them Black Swans.
Black Swans
These are events that are extremely rare, unpredictable, and are easily rationalized after the fact (think of every economist trying to explain how a bubble formed and why it popped when it did but who also didn't profit from it beforehand).
It should not surprise you that Black Swans are not predictable, and therefore, not measurable before the fact.
If we can't measure them, nor predict them, then how do we act? We limit our exposure to events like these.
4 Quadrants
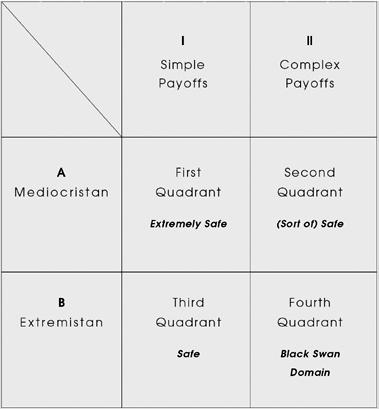
Here are the 4 famous Quadrants, from this we can reason where we should actively attempt to use mathematical models to predict things, and more importantly, know where our investments lie in it.
First Axis - Payoffs
The first axis is the Payoff axis. The first type is Simple Payoffs (Binary results). It is black/white, true/false results.
- It allows for reasoning using ideas like "if the green light is on, should you accelerate or stop?"
The other type is Complex Payoffs (Results measured in Magnitude).
It thinks about how black/white/true/false something is, it is more complex and allows phrases such as :
- "How likely are we to get hit by a car on A, B, or C street at noon?"
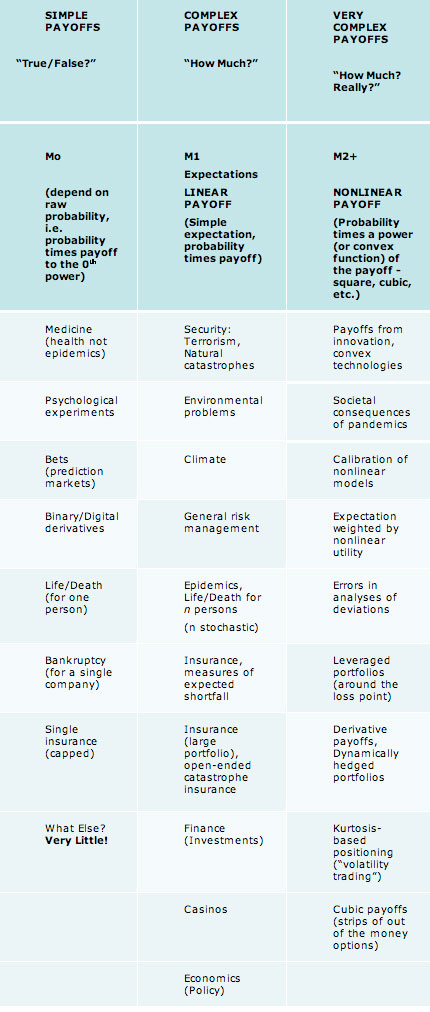
Here's a table with examples to help us better visualize it:
Second Axis - Complexity of The Environment
Extremistan vs Mediocristan. This is where things get complicated.
In very simple terms here's what they mean:
Extremistan
- Inequalities are the rule, where one single observation can radically impact the aggregate result.
- Think people's wealth, if you pick 500 random people in the street to calculate average wealth, should one of them be a billionaire they'd be accounting for over 90% of the sample data (and raising the average result amongst all 500 people).
- We also see this in Chess tournament medals, and any human informational activity, like 1% of the pop songs dominating the entire market, 1% of movies getting 90% of box office results. It leads to "Winners take it all" environments.
- This environment produces Black Swans.
- This is where things are unpredictable and compound with a few improbable events.
Mediocristan
- When your sample is large, no single observation will radically change the total aggregate
- Think: "Height or Weight distribution among humans". Hardly we will see something radical, but even if it is, it's not as pronounced as in Extremistan.
- No one will have millions of kilometers in height vs no height at all. Something that does happen when we measure Wealth, box-office movie(games, books, etc) successes.
Let's look at a more detailed view of the 4 quadrants again:
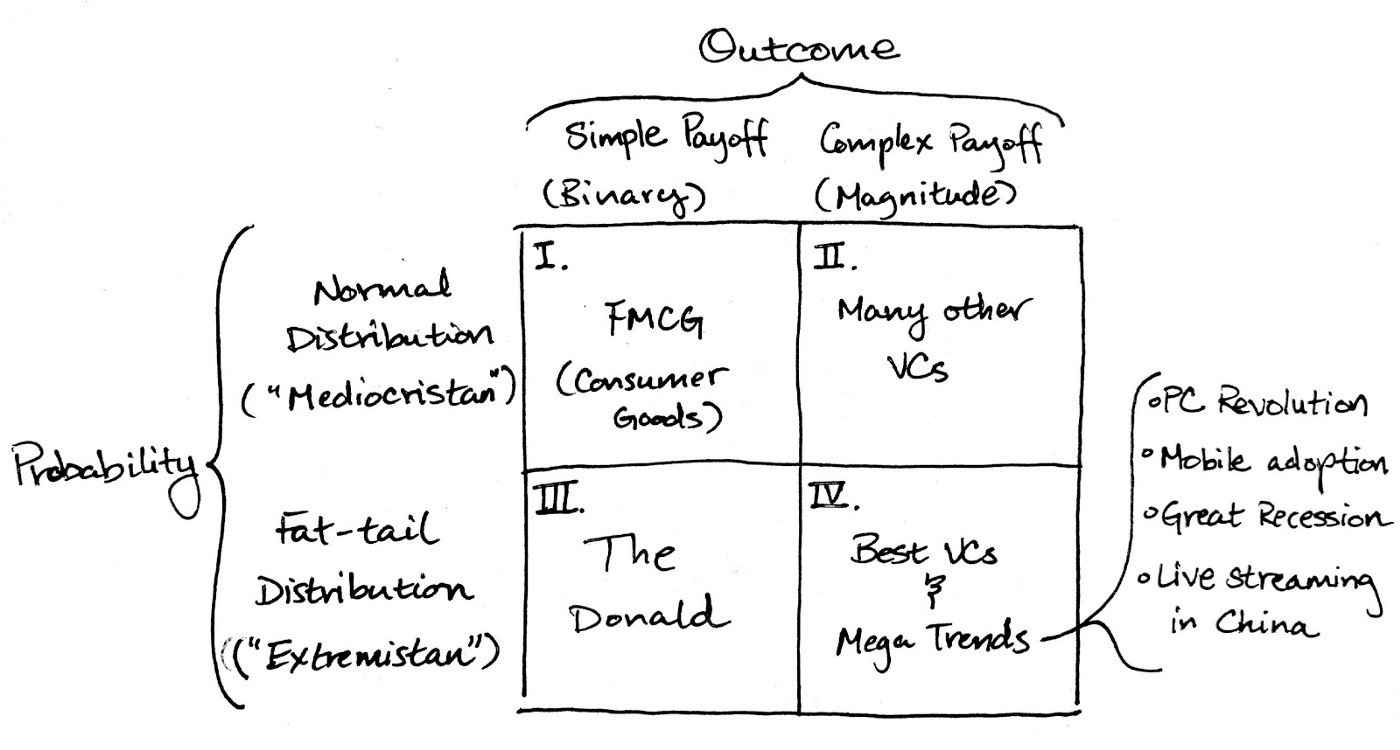
We can see what the 4 quadrants look like from a Venture Capitalist's perspective.
1st Quadrant: Consumer goods are a simple payoff (people either buy milk or they don't). Also, in the case of commonly used food, hardly anyone will buy 1000000% above average, so we can say consumer goods follow a Normal Distribution.
In case you need refreshing, here's what a Normal Distribution looks like:
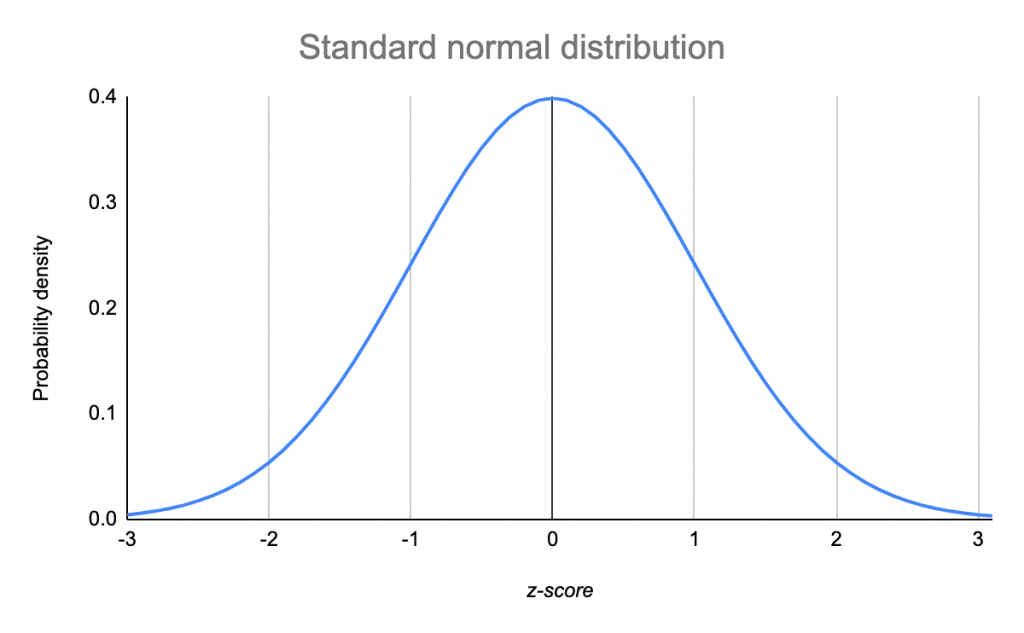
This figure presents a normal distribution, which means most consumers buy something in the middle, and exceptions are rare and pose a less important contribution to the overall sample data.
2nd Quadrant: Complex payoffs but still normal distribution, meaning from a pool of VCs one will not be overly dominant in the overall sample data. And yet to deem VCs successful takes years and multivariable analysis. More importantly, even, we have to ask "How Much" a VC was successful, not just if they are/aren't.
3rd Quadrant: Simple payoffs in elections, Donald Trump vs Hillary Clinton for example. But because a single candidate might dominate the % of votes, it lives in the Extremistan.
4th Quadrant: The land of Black Swans, unpredictable events happening here that change the status quo completely. Here we have the PC revolution, Great Recessions, and Smartphones.
Fat Tails
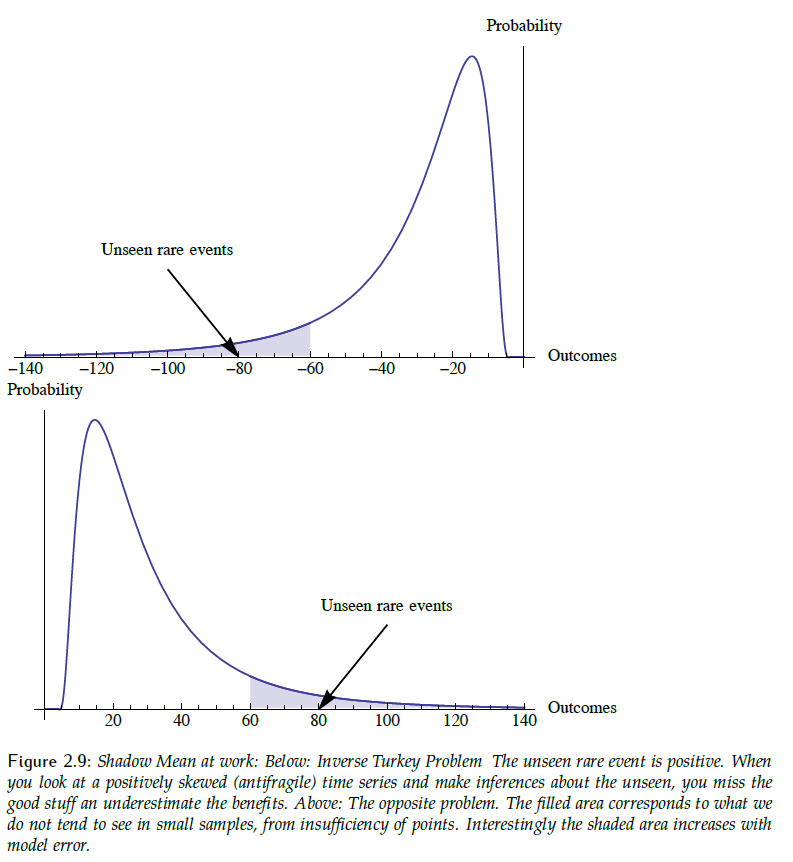
We can see in this figure what a Fat Tail distribution looks like. Where there are few unseen rare events that are more and more unlikely to happen.
However, when they do happen, they cause a massive change in the statistical properties observed (more wealth to computer geeks when the PC revolution occurred).
Now What?
Now going back to the Barbell Strategy mentioned earlier, secure investments lie in the 1st, and 2nd quadrants, things that live in the mediocristan. They are more predictable but offer lower returns on investment(ROI).
Things that are highly risky live in the 3rd (although with limited exposure to breaking) and 4th quadrants.
What Nassim suggests is that one should lead a Highly conservative / Highly risky approach.
With 90% on the 1st and 2nd quadrants, and 10% on the fourth one. Exposing a small part of your wealth to high payoff events (such as bitcoin, NFTs, highly risky stocks, etc).
The larger part would be in highly conservative investments (S&P500 indexes, some funds, ETFs, Treasury Bonds, etc).
👏 Special Thanks
Thanks to my mate André Mariano for helping me review the text and giving me some tips on which parts I could make clearer.
Tell me what you think
Do you agree with his approach, was there something not quite clear from this article? Let me know 😜
😗 Enjoy my writing?
Forward to a friend and let them know where they can subscribe (hint: it’s here).
Anything else? Just say hello in the comments :).
Join an Exclusive Tech Friendly Community! Connect with like-minded people who are interested in tech, design, startups, and growing online — apply here.
Resources
 Nassim Taleb
 Sheng Huang


